A study on built environment determinants of public health in New York City
Introduction
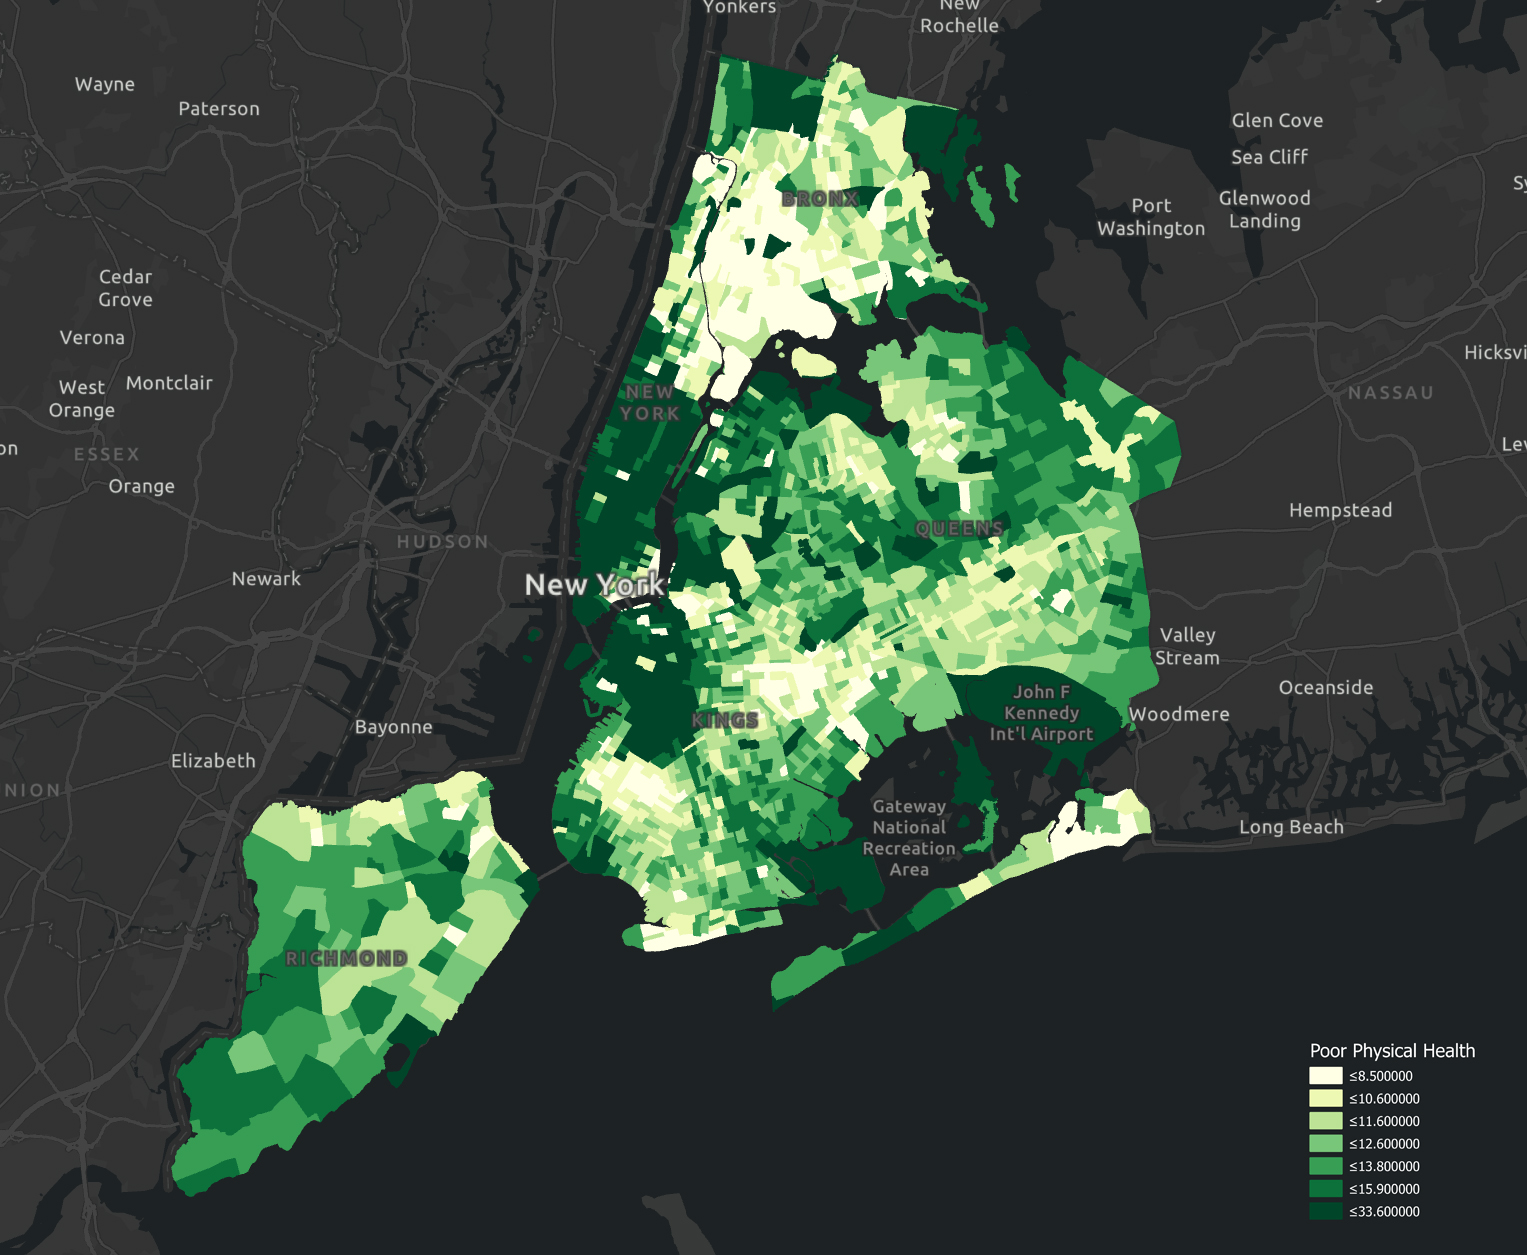
Cities provide some of the worst as well as some of the best environments for health and well-being (Burdett, et al., 2005): Challenges posed by rapid urbanization in relation to environmental stressors and socioeconomic disparities are associated with urban health and well-being. As one of the largest cities in the world, public health concerns have always plagued New York City (NYC). Studies by Thorpe et al. and Rummo et al. (2018) have found marked increases in diabetes and obesity rates in New Yorkers between 2004 and 2014. Last year, NYC has emerged as the epicenter of the COVID-19 crisis in the USA.
There is no dearth of studies attempting to identify factors influencing health and well-being in cities. Most of them entail social surveys and self-rated reports (Ballas, 2013; Carter & Horwitz, 2014; Von Szombathely et al., 2017). These analyses focus either on investigating how public health is affected by population demographics in terms of size, density, and composition (Galea et al., 2005; Rydin et al., 2012) or association between environment determinants and well-being (Krefis et al., 2018; Salgado et al., 2020).
Green space provision
Schipperijn et al (2017) found that individuals with greater proximity to urban parks have more healthy habits. Pereira et al (2012) mentioned that the prevalence of trees lined streets or footpaths is associated with a lower risk of coronary heart disease. The study conducted by Adhikari et al (2020) stated that green spaces can lead to improvement in health-related quality of life due to the ecological benefits.
Accessibility of amenities
Zhang et al (2008) mentioned that people with low accessibility to health care services tend to be more severely ill when diagnosed. Scheffler et al (2015)’s study highlighted that clinics and pharmacies’ inadequate availability impacts adverse health outcomes. It is found by Kelly et al (2014) that frequent fresh food market shopping is associated with increased vegetable intake, leading to a lower risk of chronic diseases.
Environmental Quality
Wong et al (2001) and Dockery (2001) found that high air pollutant levels coupled with increasing vehicular traffic volume are linked to daily mortality in cities.
However, there remains a gap in a holistic correlation study between built environment factors and physical health in NYC.
Research Objectives & Hypothesis
The study, therefore, aims to investigate the relationship between physical health and built-environment factors, identify the most influential determinants for health promotion, and propose spatial planning strategies for NYC. The specific hypothesizes are as follows:
Hypothesis 1: Greater environmental quality as defined by lesser air pollution, greater green coverage, and higher degrees of access to parks is correlated to improved physical health for adult New Yorkers.
Hypothesis 2: Greater access to healthier food choices, as reflected through proximity to fresh food markets, and areas covered under the FRESH policy is correlated to improved physical health for adult New Yorkers.
Hypothesis 3: Proximity to healthcare facilities such as pharmacies and clinics is correlated with improved physical health for adult New Yorkers.
Hypothesis 4: Greater degrees of infrastructure coverage promoting a healthy lifestyle as defined by the proximity to sports facilities, walkability index, bicycle lane density is correlated to improved physical health for adult New Yorkers.
Hypothesis 5: Of the factors above, their impacts on adults’ physical health have spatial disparity across NYC.
Methodology
Data Source
The data collected are categorized as numerical data and spatial data. The numerical data include health, demographics, and some descriptive environmental information such as air pollution, which are collected from “500 Cities” Health Project in the US, NYC Open Data, NYC EDC, Social Explorer, and U.S. Environmental Protection Agency. The spatial data refers to geo-referenced environmental information, all of which are based on the shapefile of GIS, and are collected from Open Street Map. The study assumes that the built environment in NYC has not changed significantly from 2019 until now (because the Open Street Map provides the latest spatial information). There are 10 independent variables and 3 control variables. The dependent variable represents “general poor health”, which is the index describing the percentage of adults reporting at least 14 unhealthy days in a month. The spatial data is processed with a buffer zone indicating their service range. The buffer radii are defined according to existing literature and empirical practice in urban planning and design practice. The independent variable data are normalized into the interval [0,10] for coefficient comparison.

Research Design
Based on the research objective and the hypothesis, the research framework firstly follows a conventional OLS regression model to explore the relationship between health and the built environment, coming with statistical testing to check the parameters. Especially, if the model appears with spatial autocorrelation in the residuals, then the spatial auto-correlation regression (SAR) model such as Matrix Exponential Spatial Specification Model (MESS) would be considered. The comparative studies between different boroughs (Bronx, Brooklyn, Manhattan, Queens, and Staten Island) are also employed.
Matrix Exponential Spatial Specification Model (MESS)
The MESS model is for modeling spatially dependent data. It can produce estimates and inferences like those from conventionally SAR models but has analytical, computational, and interpretive advantages (Zaefarian et al., 2017). The model considers spatial disparity and retains the P-value and coefficients of independent variables.
Regression Results
Comparisons Between Models
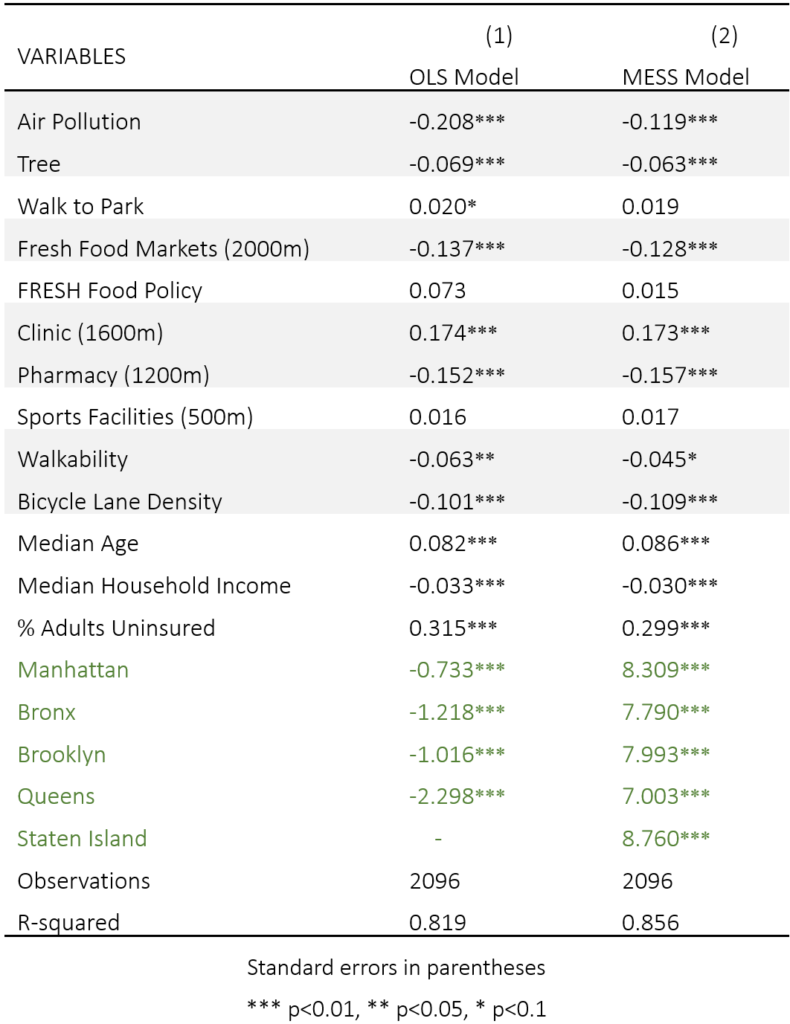
The table below summarizes the results for the OLS and the MESS model. The two models yielded marginally different results; the statistically significant built-environment variables varied in the two models. The R2 value of MESS model (0.85) is higher than the OLS model counterpart (0.82), indicating MESS model has a better explanation capacity. According to the heteroscedasticity and the multicollinearity test results (appendix 3.1.1), the OLS model is inefficient and could lead to biased inferences regarding individual factors. Moreover, the spatial autocorrelation test (appendix 3.1.2) suggests there is spatial autocorrelation present in the residuals of the traditional OLS model applied to geospatial data. Given the MESS model is capable to reduce the impact of autocorrelation in residuals, we prioritise our focus on the MESS model.
Empirical Results of MESS Model
The shaded cells in the above table indicate environmental factors that are vital determinates of physical health, including Air Pollution, Tree Coverage, proximity to Fresh Food Markets, Clinic, Pharmacy, and infrastructure coverage of active mobility especially the Bicycle Lane Density. The results partially support their respective hypotheses 1, 2, 3, and 4.
From the coefficients, Hypothesis 4 is well supported as both Walkability and Bicycle Lane Density have significant negative effects to poor health, denoting the promotion of active travel leads to better physical health in NYC.
Interestingly, the factors’ coefficients of Hypothesis 3 contradict each other, with proximity to Clinic showcase significant positive effect whilst Pharmacy has a significant negative effect on physical health. The explanation could be made from a previous study that: clinic practitioners minimize the total traveling distance between patients and the facility to reduce cost and improve efficiency (Peng, 2014). Therefore, the positive coefficient of the Clinic is the result of location choice, and comparatively, expanding the coverage of the Pharmacy could be a more efficient and operable way for planners to improve urban health services. Hypotheses 1 and 2 are difficult to ascertain as only partial factors exhibit statistical significance, suggesting the varying effects of environmental enhancement and fresh food accessibility improvement actions regarding shaping a healthier city. However, as the borough-based dummy variables significantly influence the poor health rate which strongly supports Hypothesis 5 and the fact that local variances are eroded in NYC global model, the two hypotheses could be further tested in a comparative study in different boroughs.
Comparative Study in Different Boroughs
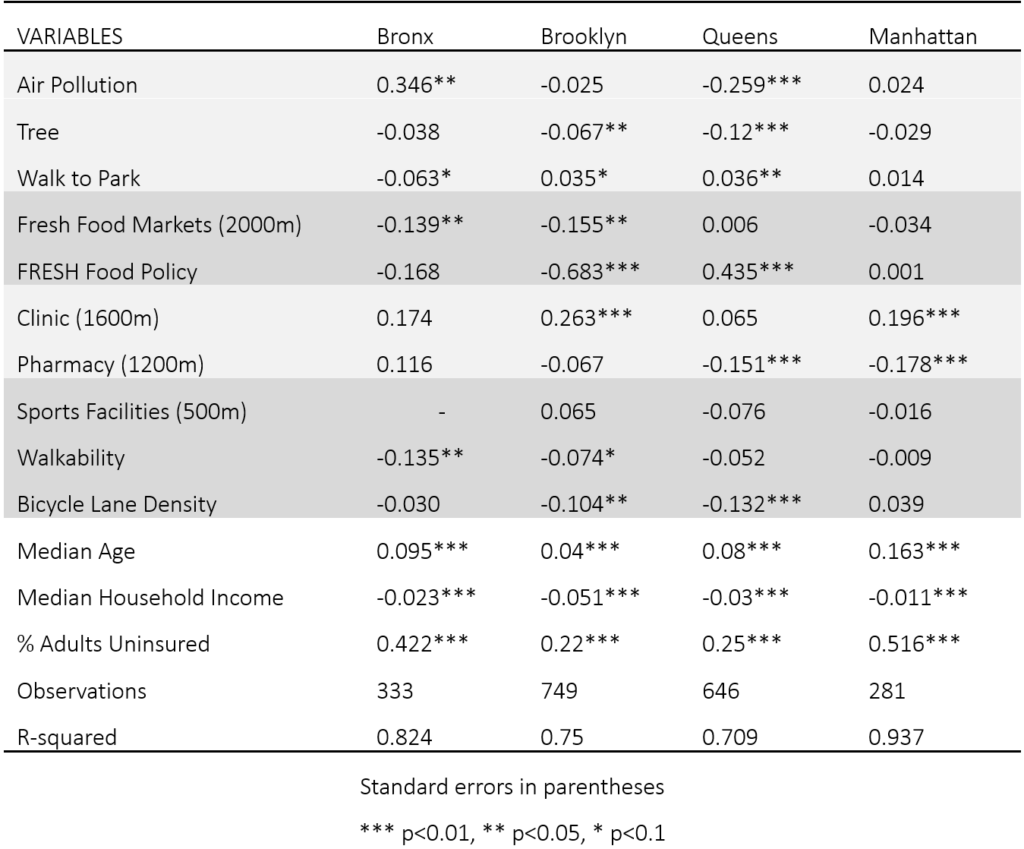
The table below indicates the empirical results of the MESS Model in different boroughs. Overall, Hypothesis 5 can be further supported that for different boroughs, the significant variables are different, and the health condition can be well predicted in Manhattan with R-squared 0.93. The results in lower-income boroughs, Bronx and Brooklyn, support Hypothesis 1, 2, 4, indicating some basic factors like environmental quality, accessibility to healthy food, and infrastructures promoting physical exercise are lacking in poor areas. The results in Queens support Hypothesis 1, 3, 4, showing that the food insecurity problem is less serious while healthcare facilities become important. The results in Manhattan can only support Hypothesis 4, which might because the built environment in Manhattan is more completed, and people with higher income have a stronger ability to acquire diverse services.
Discussions
Key Variables Interpretation
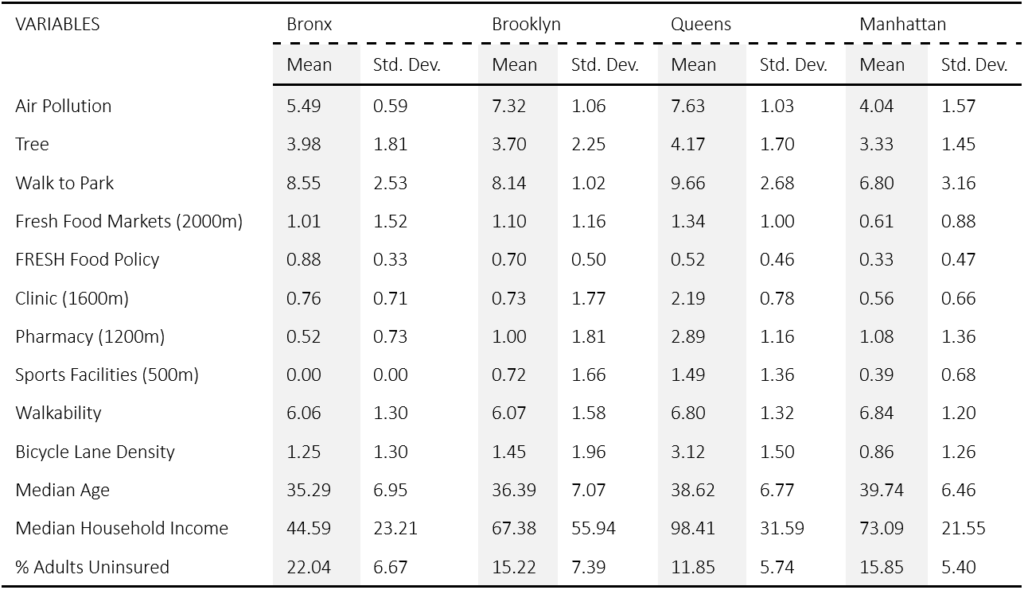
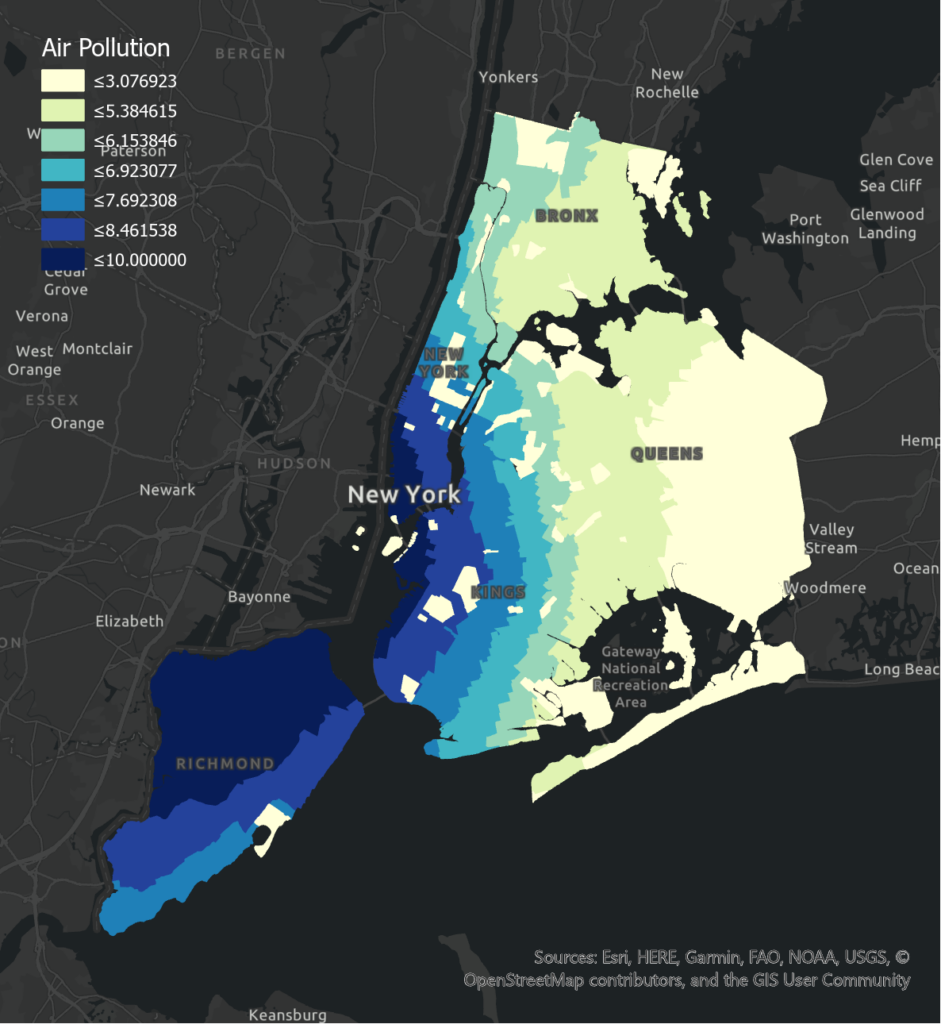
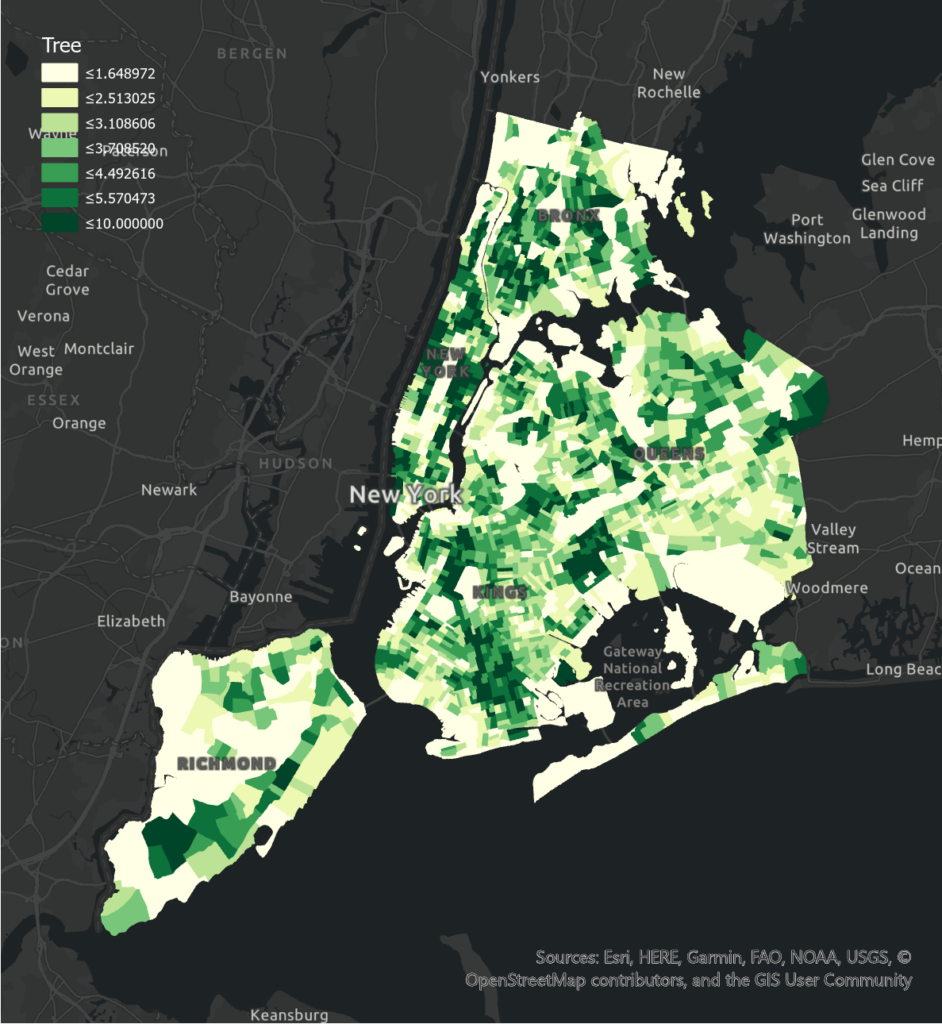
Air Pollution shows a positive association with poor health levels in Manhattan and Bronx while Tree Coverage is negatively correlated with poor health levels in all boroughs. It is observed that the least air pollution in Queens is illustrating a significant negative association. In Manhattan where high mean air pollution with high variation is presented, there is a significant positive effect on poor health. The reason could be the diseases caused by the exposure to particulate matter emitted from vehicles in different areas. On the other hand, in terms of Tree Coverage, the negative correlation is more obvious in boroughs that have a smaller number of planted trees with less variation such as Queens and Brooklyn. There is a greater prevalence of trees inlined streets or footpaths in Manhattan and Bronx as their mean and standard deviation are greater compared to other boroughs, which can lead to a better health condition.
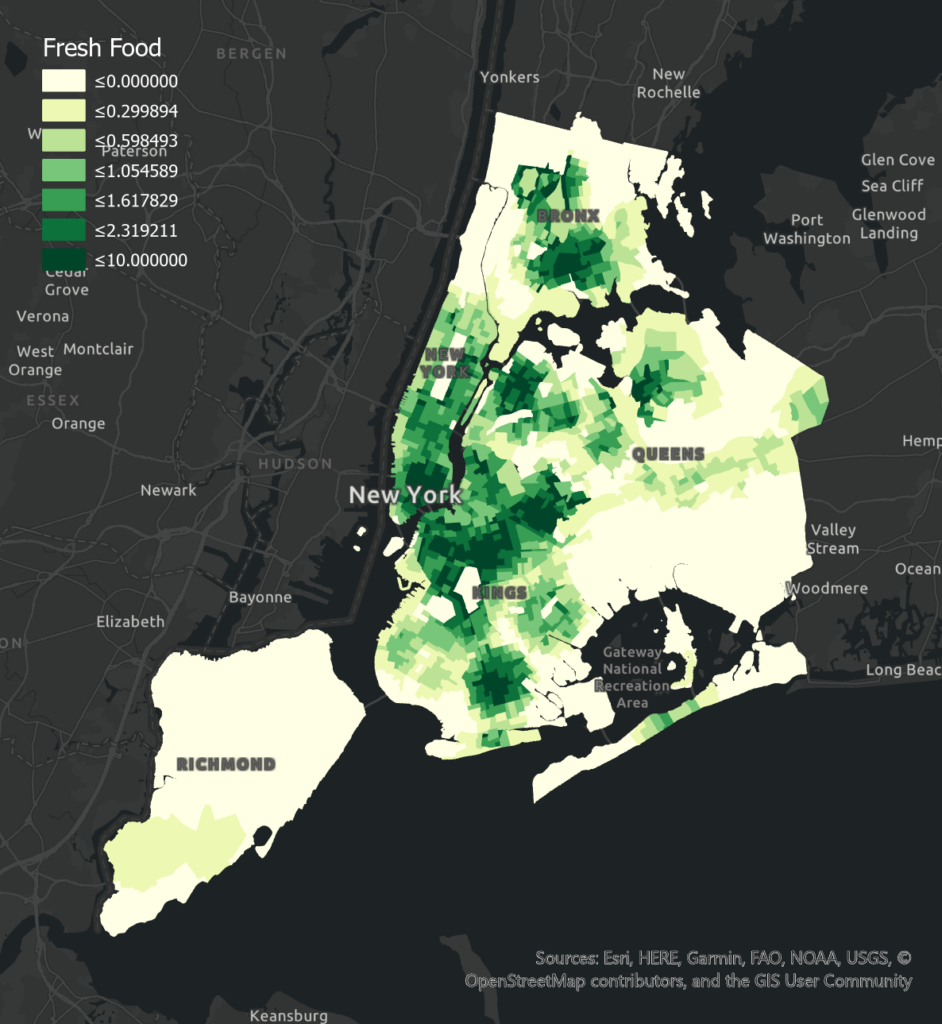
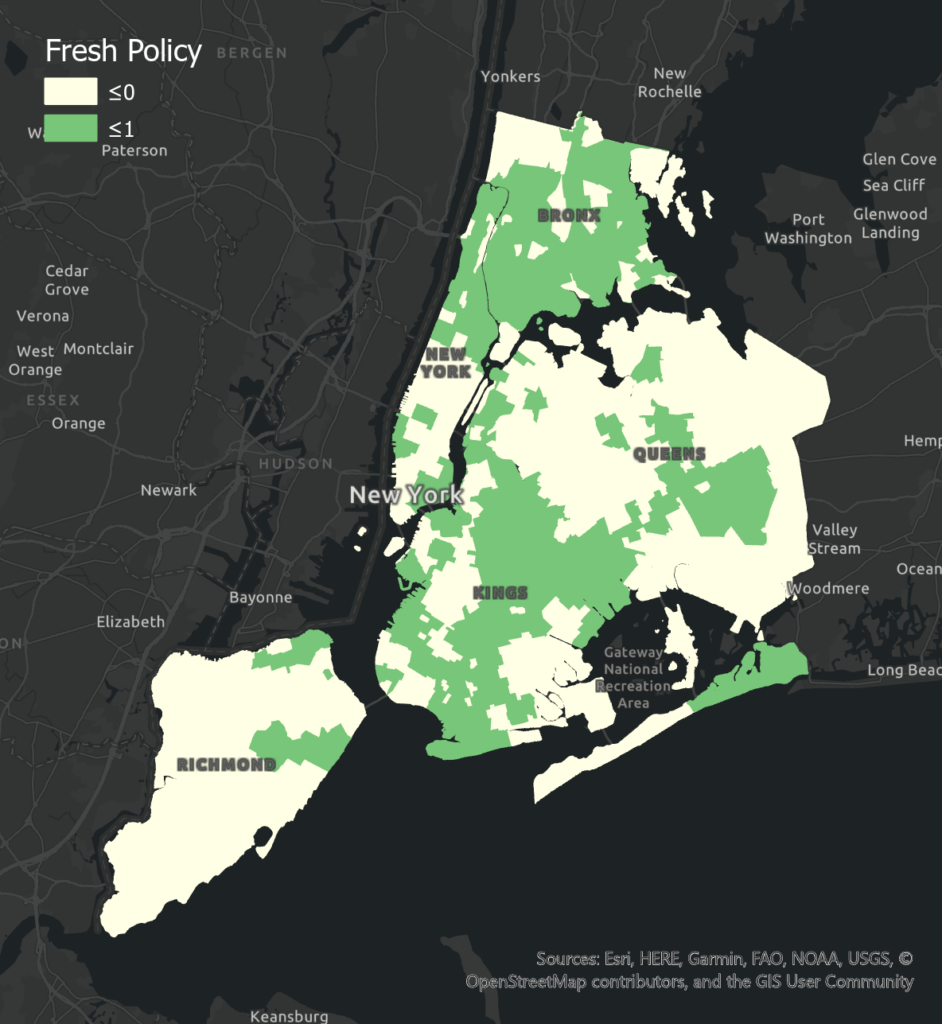
Access to Fresh Food Markets has a significant negative effect on poor health levels in Bronx and Brooklyn, and an insignificant effect in Manhattan. Compared to other boroughs, Manhattan has more access to fresh food, which may lead to less variation of food access in different tracts and less obvious correlation. Queens has an insignificant positive correlation, which may result from its smaller numbers of the fresh food market and the poor health level may be influenced by other factors. Fresh Food Policy has a negative effect on poor health levels in Brooklyn and Bronx. The more significant correlation in Brooklyn may be due to its less fresh food incentives and larger variation among tracts. Queens has a significant positive correlation which may result from less fresh food policies in this borough and poor health level can be largely affected by other factors. Manhattan has an insignificant positive correlation which may be influenced by its higher population income. People with higher income may be less affected by fresh food policies when purchasing food.
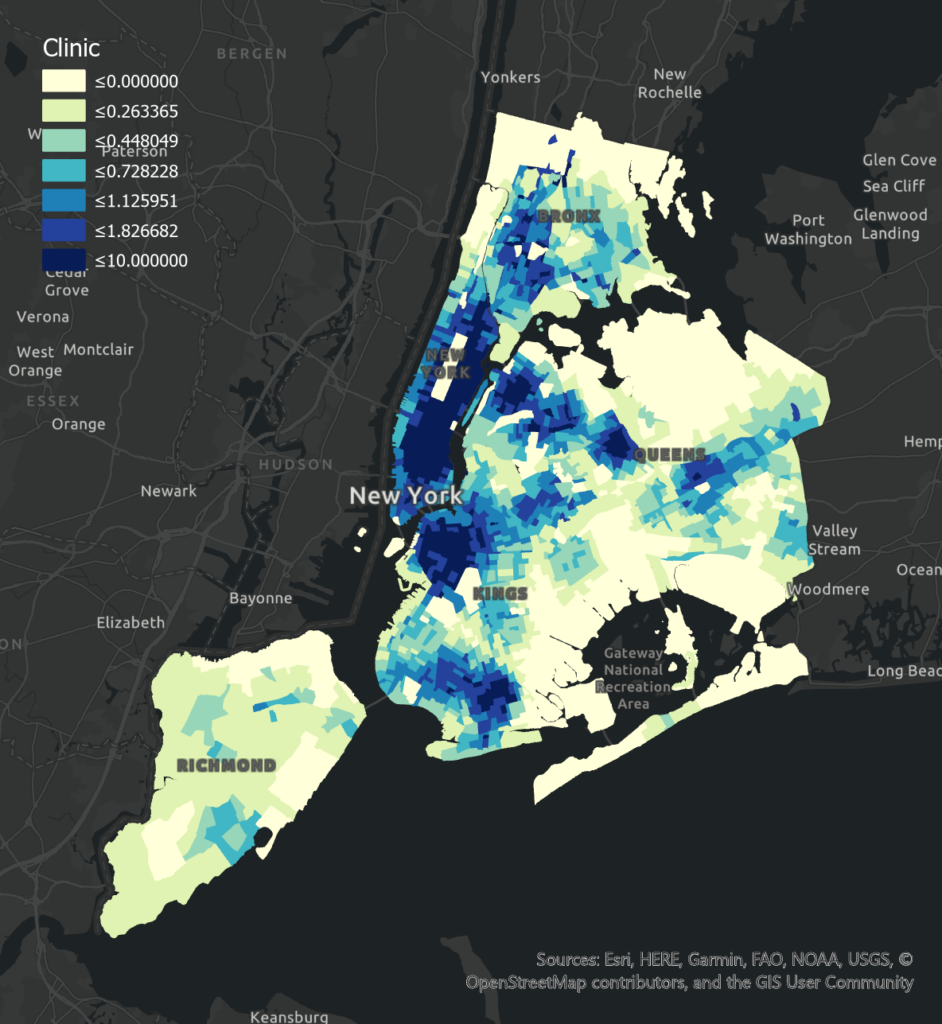
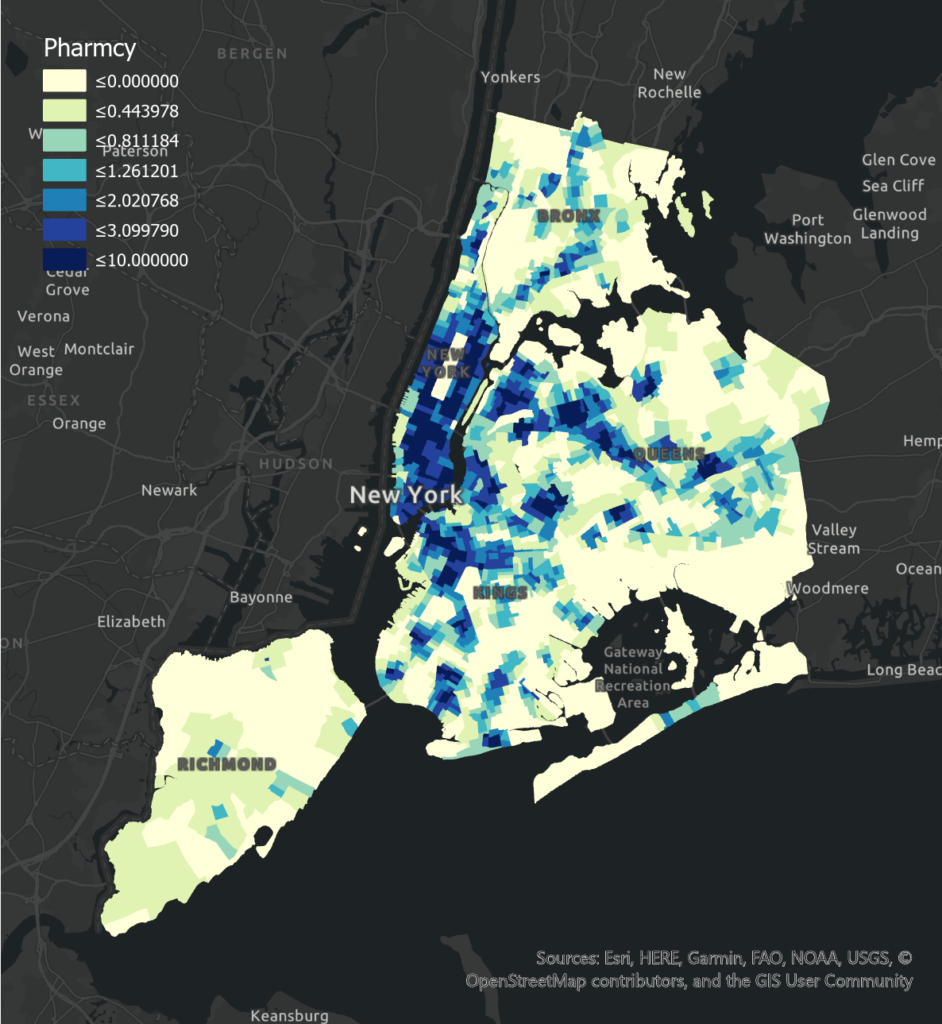
Notably, Clinic has a significant positive correlation with poor health levels in all boroughs. The high mean and high variation of clinics in Brooklyn and Manhattan lead to the most obvious positive association compared to Bronx and Queens. Besides the reason for positive effect related to location choice has been explained in the previous section (3.2), another reason could be that people in those areas have adequate access to other forms of health service providers. Moreover, Pharmacy shows a significant negative correlation of poor health level in Manhattan and Queens due to people have available access and choices in seeking medical support. The negative association is insignificant and less obvious in Brooklyn because the mean of the existing pharmacy is relatively low. In Manhattan, the percentage of adults without insurance is the lowest while the median income is highest, indicating they are more willing to access the pharmacy when there are minor health concerns.
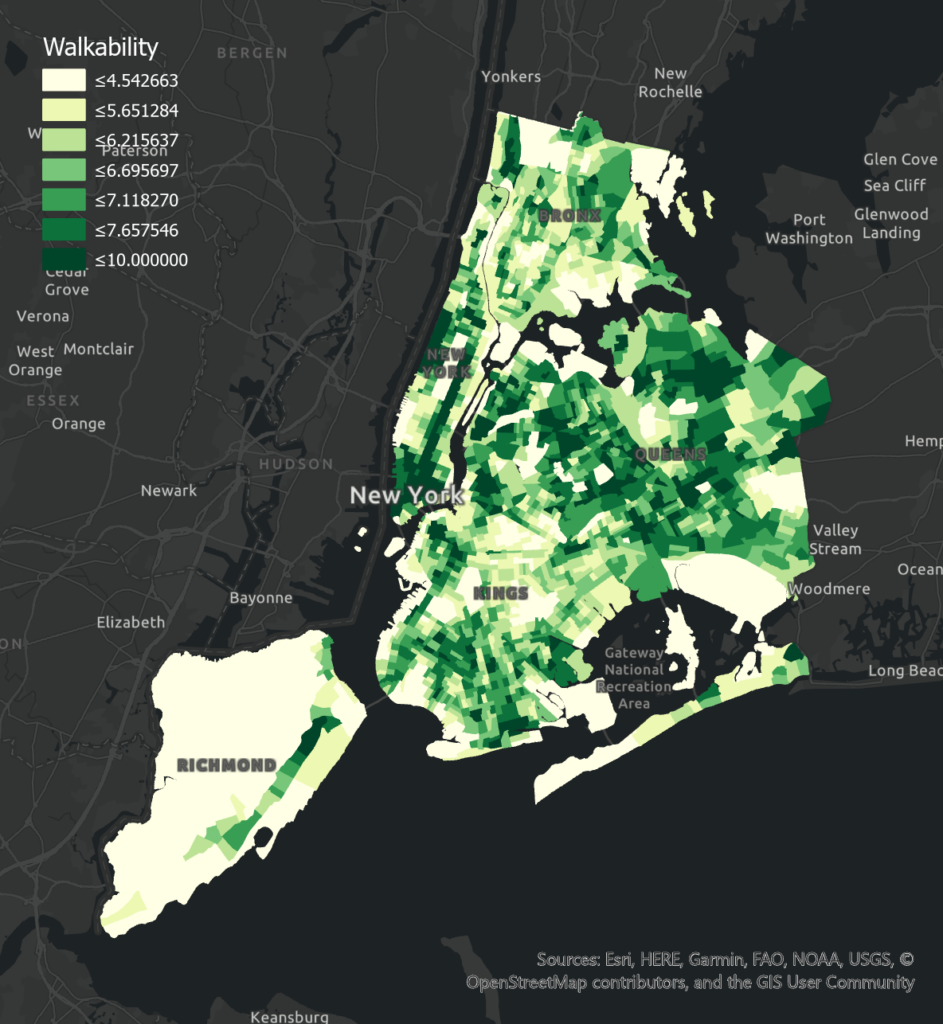
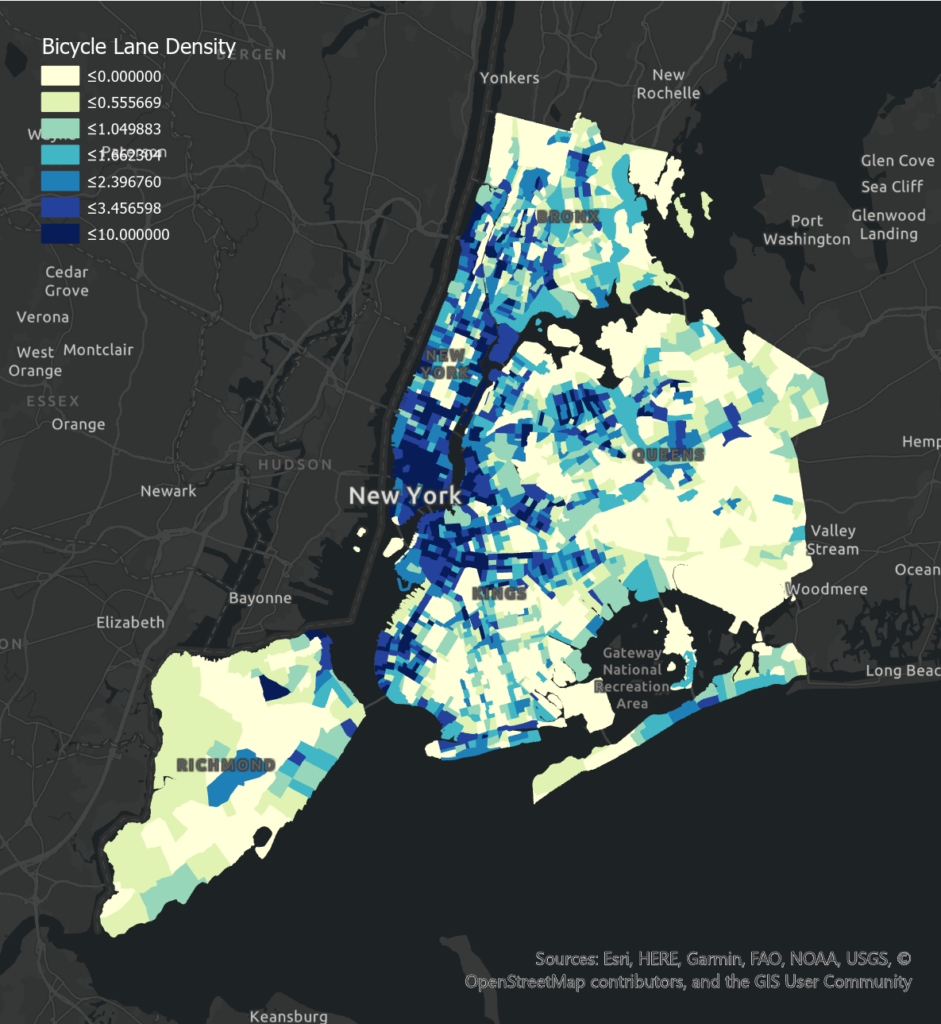
Walkability has a negative effect on poor health levels in all boroughs. Negative correlations in Bronx and Brooklyn are significant, possibly because of their less pedestrian-friendly built environment and a greater number of young populations who might prefer walking to taking transit. Bicycle Lane Density has a negative effect on poor health levels in Bronx (insignificant), Brooklyn, and Queens, while an insignificant positive effect in Manhattan. Manhattan has much higher bicycle lane density but people living here are usually with high income and may have more choices of transportation. Other reasons like population age and road safety may also influence people’s transition mode.
Planning Implications
(1) Improve accessibility to fresh and healthy food in low-income communities
Food accessibility plays an important role in the health condition of people living in low-income boroughs. Compared to high-income communities, low-income communities are more vulnerable to food insecurity issues. Therefore, promoting zoning and financial incentives for establishing and retaining grocery stores should be targeted in underserved communities. Food Retail Expansion to Support Health (FRESH) program provides and maintains grocery stores in underserved areas across NYC (NYCEDC), helping to decrease disparities in accessing healthy, fresh, and affordable food.
(2) Provide sufficient healthcare facilities
The current distribution of healthcare facilities is uneven and due to some other more fundamental environmental issues, the influence of the distribution of healthcare facilities does not show a significant correlation with health conditions in low-income communities. But referring to high-income communities, healthcare facilities are necessary to meet residents’ higher-level demand. Therefore, the Appropriate distribution of healthcare facilities to fulfill residents’ needs are necessary and does help to reduce the existing health inequality gap in New York.
(3) Encourage physical exercise by improving facilities of active mobility
Authorities should firstly extend bicycle lanes, especially for communities located in the periphery. According to DOT (2016), since 2010 expanded and enhanced the on-street bike network, there was 75% growth in commuting to work by bicycle in Brooklyn. Therefore, the construction of the bicycle lane can facilitate people to commute by cycling, which further promotes physical health.
Second, building a pedestrian-friendly environment in lower-income areas is important for promoting health equity. The walkability is significantly lower in lower-income areas, indicating the diminished quality of life. Pedestrianization is one of the foundations of urban mobility, underpinning connectivity between people and parks, food markets, and health services.
(4) Promote green infrastructure for better urban environmental quality Strategies promoting green infrastructure would contribute to both physical environmental improvement and physiological enhancement for the local people. Green infrastructure with more tree canopy would help to better spatial quality for people’s daily recreation and relieve the negative impacts from rapid urban constructions.
Conclusions
This study aims to find the environmental determinants of public health. An OLS and a spatial regression model are set up successfully to model the health situations in NYC. It is evident that air pollution, tree coverage, fresh food access, daily health service such as clinics and pharmacies, and infrastructure for pedestrians contribute significantly to public health. Surprisingly, the walk to park index makes no statistically significant contribution in this study. The research indicates that the natural environment within cities, including air quality and tree coverage, should be taken into consideration. Strategies promoting green infrastructure would help relieve environmental pressures associated with urban density. Additionally, as health-related factor involves various urban aspects, encouraging hybrid service infrastructures integrating healthcare and fresh food, and pedestrian path system would ensure comprehensive access to services, and enhance the urban vitality with urban multifunction.
References
Adhikari, B., Mishra, S. R., & Dirks, K. N. (2020). Green space, health, and wellbeing: considerations for South Asia. The Lancet Planetary Health, 4(4), e135–e136. https://doi.org/10.1016/s2542-5196(20)30056-5
Ballas, D. (2013). What makes a “happy city”?. Cities, 32, S39–S50. https://doi.org/10.1016/j.cities.2013.04.009
Carter, M., & Horwitz, P. (2014). Beyond Proximity: The Importance of Green Space Useability to Self-Reported Health. EcoHealth, 11(3), 322– 332. https://doi.org/10.1007/s10393-014-0952-9
Dockery, D. W. (2001). Epidemiologic Evidence of Cardiovascular Effects of Particulate Air Pollution. Environmental Health Perspectives, 109, 483. https://doi.org/10.2307/3454657
Galea, S., Freudenberg, N., & Vlahov, D. (2005). Cities and population health. Social Science & Medicine, 60(5), 1017–1033. https://doi.org/10.1016/j.socscimed.2004.06.036
Kelly, M., Seubsman, S., Banwell, C., Dixon, J., & Sleigh, A. (2014). Thailand’s food retail transition: supermarket and fresh market effects on diet quality and health. British Food Journal, 116(7), 1180–1193. https://doi.org/10.1108/bfj-08-2013-0210
Krefis, A., Augustin, M., Schlünzen, K., Oßenbrügge, J., & Augustin, J. (2018). How Does the Urban Environment Affect Health and Well-Being? A Systematic Review. Urban Science, 2(1), 21. https://doi.org/10.3390/urbansci2010021
Pereira, G., Foster, S., Martin, K., Christian, H., Boruff, B. J., Knuiman, M., & Giles-Corti, B. (2012). The association between neighborhood greenness and cardiovascular disease: an observational study. BMC Public Health, 12(1). https://doi.org/10.1186/1471-2458-12466
Peng, Qingjin & Afshari, Hamid. (2014). Challenges and Solutions for Location of Healthcare Facilities. Industrial Engineering Management. 03. 10.4172/2169-0316.1000127.
Rydin, Y., Bleahu, A., Davies, M., Dávila, J. D., Friel, S., De Grandis, G., Groce, N., Hallal, P. C., Hamilton, I., Howden-Chapman, P., Lai, K.-M., Lim, C., Martins, J., Osrin, D., Ridley, I., Scott, I., Taylor, M., Wilkinson, P., & Wilson, J. (2012). Shaping cities for health: complexity and the planning of urban environments in the 21st century. The Lancet, 379(9831), 2079–2108. https://doi.org/10.1016/s01406736(12)60435-8
Salgado, M., Madureira, J., Mendes, A. S., Torres, A., Teixeira, J. P., & Oliveira, M. D. (2020). Environmental determinants of population health in urban settings. A systematic review. BMC Public Health, 20(1). https://doi.org/10.1186/s12889-020-08905-0
Scheffler, E., Visagie, S., & Schneider, M. (2015). The impact of health service variables on healthcare access in a low resourced urban setting in the Western Cape, South Africa. African Journal of Primary Health Care & Family Medicine, 7(1). https://doi.org/10.4102/phcfm.v7i1.820
Schipperijn, J., Cerin, E., Adams, M. A., Reis, R., Smith, G., Cain, K., Christiansen, L. B., Dyck, D. van, Gidlow, C., Frank, L. D., Mitáš, J., Pratt, M., Salvo, D., Schofield, G., & Sallis, J. F. (2017). Access to parks and physical activity: An eight country comparison. Urban Forestry & Urban Greening, 27, 253–263. https://doi.org/10.1016/j.ufug.2017.08.010
Von Szombathely, M., Albrecht, M., Antanaskovic, D., Augustin, J., Augustin, M., Bechtel, B., Bürk, T., Fischereit, J., Grawe, D., Hoffmann, P., Kaveckis, G., Krefis, A., Oßenbrügge, J., Scheffran, J., & Schlünzen, K. (2017). A Conceptual Modeling Approach to Health-Related Urban Well-Being. Urban Science, 1(2), 17. https://doi.org/10.3390/urbansci1020017
Wolf, K. L., Lam, S. T., McKeen, J. K., Richardson, G. R. A., van den Bosch, M., & Bardekjian, A. C. (2020). Urban Trees and Human Health: A Scoping Review. International Journal of Environmental Research and Public Health, 17(12), 4371. https://doi.org/10.3390/ijerph17124371
Wong, C.-M., Ma, S., Hedley, A. J., & Lam, T.-H. (2001). Effect of Air Pollution on Daily Mortality in Hong Kong. Environmental Health Perspectives, 109(4), 335. https://doi.org/10.2307/3454891
World Health Organisation. (2020). Social determinants of health. Www.who.int; WHO. https://www.who.int/health-topics/socialdeterminants-of-health.
Zaefarian, G., Kadile, V., Henneberg, S. C., & Leischnig, A. (2017). Endogeneity bias in marketing research: Problem, causes and remedies. Industrial Marketing Management, 65(May), 39–46. https://doi.org/10.1016/j.indmarman.2017.05.006
Zhang, X., Geiss, L. S., Cheng, Y. J., Beckles, G. L., Gregg, E. W., & Kahn, H. S. (2008). The Missed Patient With Diabetes: How access to health care affects the detection of diabetes. Diabetes Care, 31(9), 1748–1753. https://doi.org/10.2337/dc08-0527