This is an data analysis and visualization exercise of Singapore resale flats market, with 6 key questions leading to meaningful insights.
The data source is from https://data.gov.sg/dataset/resale-flat-prices; The analysis process is done in RStudio.
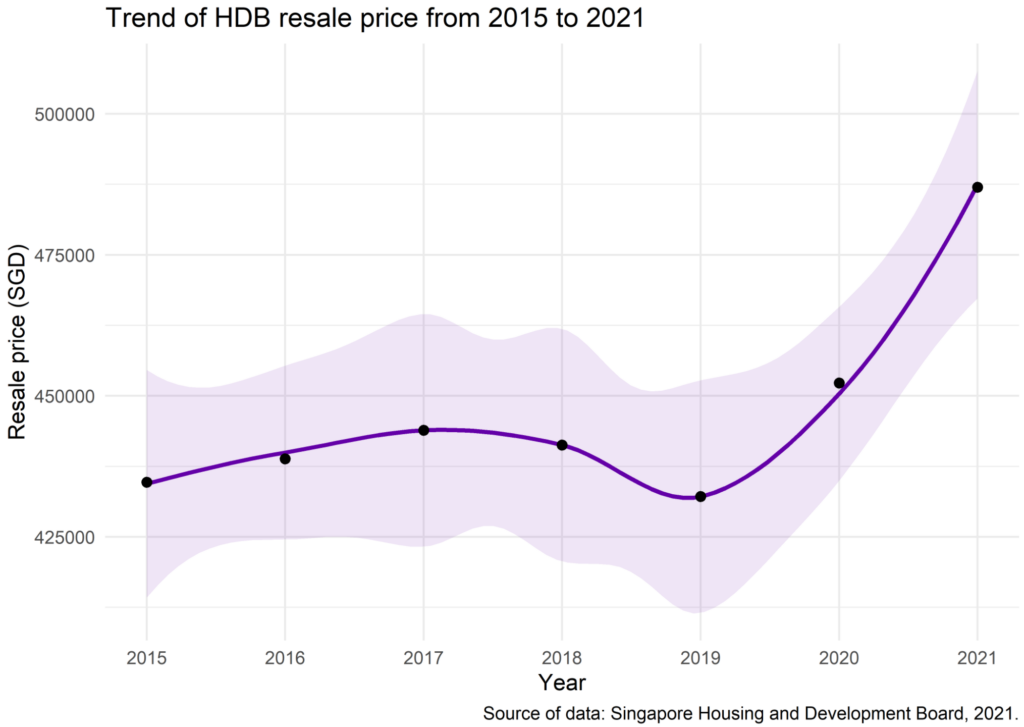
Question 1: What is the general trend of HDB resale prices in the recent six years?

It can be seen from this figure that resale flat prices were relatively stable between 2015-2019, fluctuating within a range of 15000, with a slight increase in 2015-2017 and a decrease in 2018 and 2019. In 2020, however, the resale price began to rise rapidly and by early 2021 the average price had exceeded 485,000. such a dramatic change was reminiscent of an important social change in 2020 – the COVID-19 pandemic. Therefore in the latter question, I will look more closely at the changes in the resale market during the pandemic.
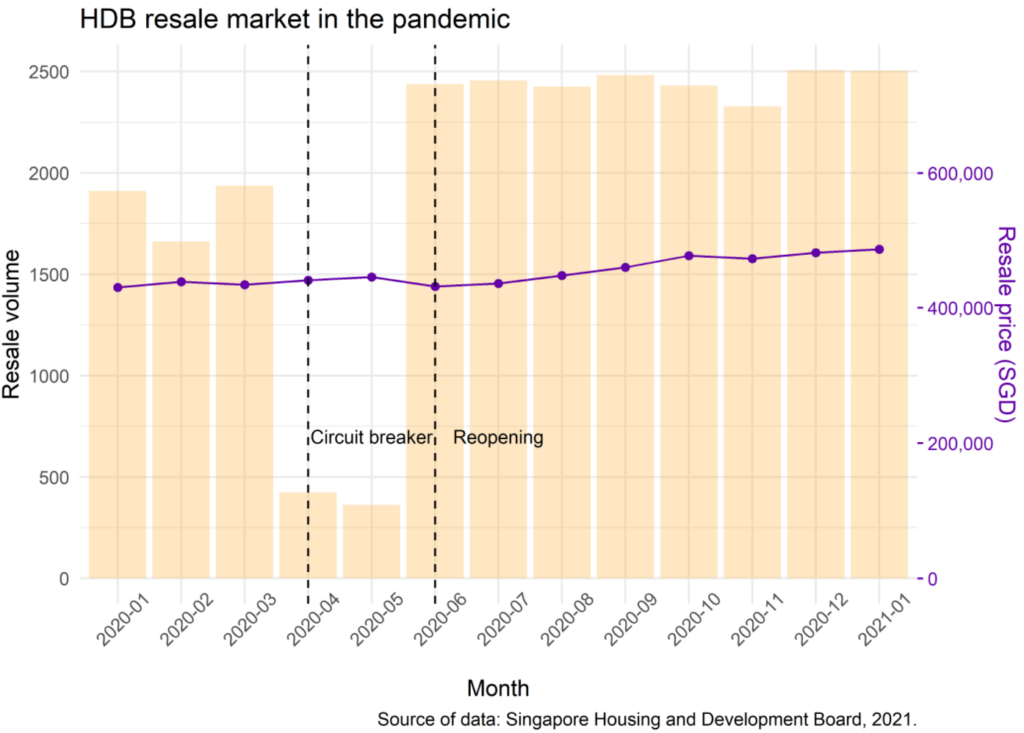
Q2: How has the pandemic and related policies affected the resale market?
In the resale flats market, there are two major elements, one is the price, another one is the trading volume. I wish to plot the two pieces of information in the same figure and overlay them with two key pandemic phrases – circuit breaker and the reopening.

The graph shows that the pandemic phases had a clear impact on the HDB resale market: transaction volumes dropped precipitously after the start of the April circuit-breaker and then rebounded rapidly after the reopening. According to the ERA Realty officer, the pent-up demand accumulated during Singapore’s eight-week “circuit-breaker” period was behind the surge in transaction volumes. Despite the circuit-breaker measures, HDB resale prices remained stable, while resale prices rose by month after the reopening, it’s probably encouraged by the sharp rise in demand.
Question 3: How have prices fluctuated in the last year for different flat types?
Here I play with boxplot to create fun visualization as well as reduce data transformation steps. As “month” contains 12 variables, it’s a bit messy to plot with. Using lubridate package, month can be transformed to quarters.

As the number of rooms rises, the average price per sqm decreases. 3,4,5 ROOM has many outliers with extremely high prices per sqm. The flat type with the highest price fluctuations in the last year was 1 ROOM, which increased by about 1000 SGD/sqm from Q1 to Q4, I guess it’s because 1 ROOM is traded in smaller volumes, while the other flat types are traded in larger volumes so their market is more stable. In Q2, the average price fluctuated in different directions, but in Q3 and Q4, they were all higher than in Q1.
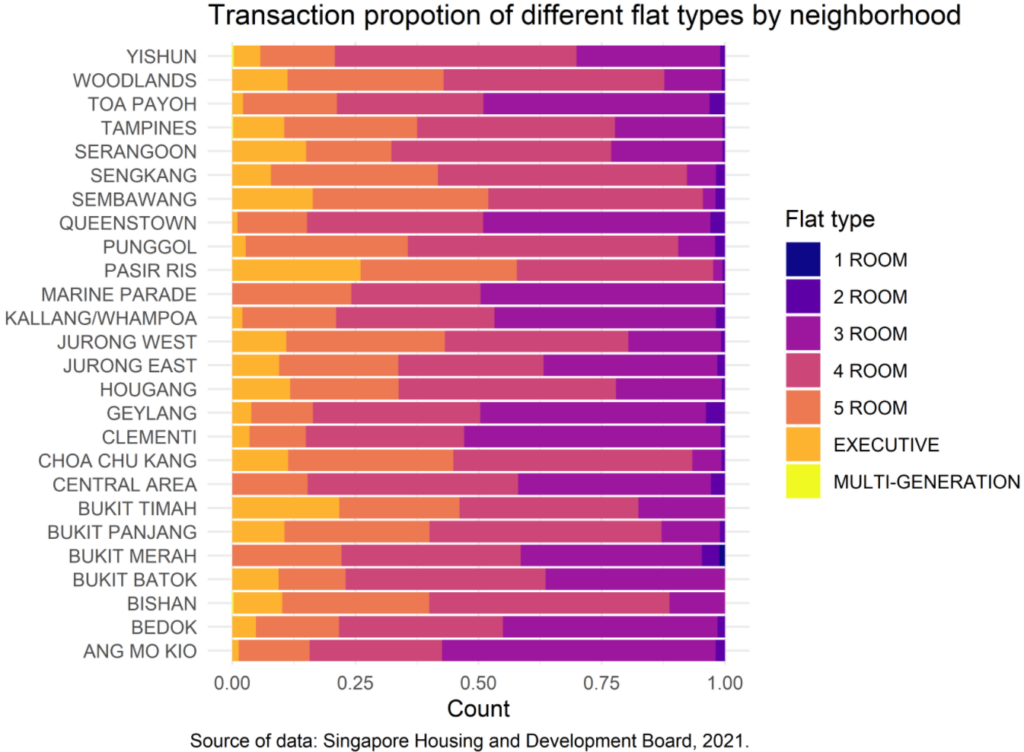
Question 4: Are similar flats sold across Singapore at the same time?

Neighborhoods exhibit differences in the flat type structure, especially in the proportion of 3 ROOM flats. In Sembawang, Sengkang, Pasir Ris, there are very few 3 ROOM resale flats with a large proportion of 4,5 ROOM flats. However, in Ang Mo Kio, Queenstown, and Clementi, the proportion of 3 ROOM flats reach nearly 50%.
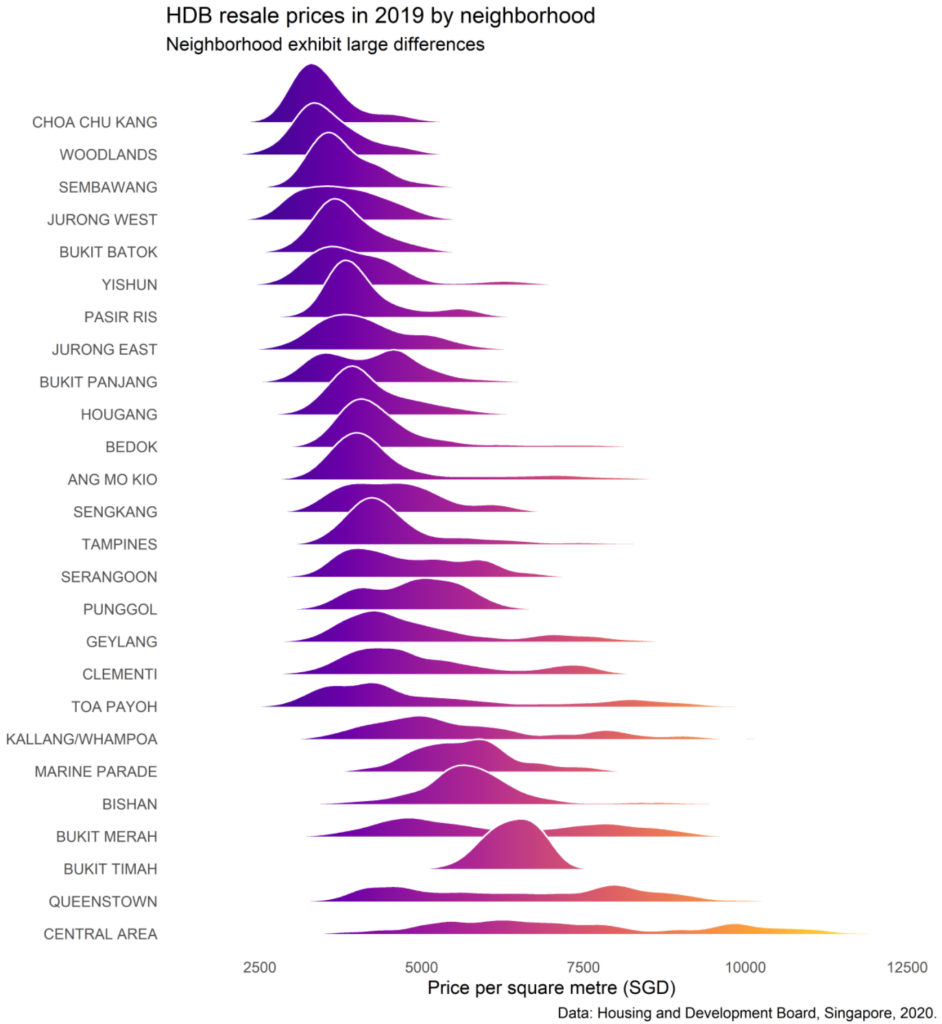
Question 5: How does the resale flats price of a neighborhood different from others?

The plot shows the distribution of price per sqm across neighborhoods. The central area looks interesting as it has the highest housing price whereas the price distribution is scattered. This matches the diversity of housing in the central area that not only has modern skyrise apartments but also has old communities. Looking at the neighborhood with a high concentration of price like Choa Chu Kang, Woodlands, Sembawang, it’s easy to tell that they are all residential neighborhoods with little mixed-use. From the figure’s top to bottom, as the average price per sqm increases, the diversity also increases, this reveals that the concentration of residential housing does improve the affordability.
Question 6: How does the feature of a neighborhood different from others?
The dataset contains many informative factors that could give us hints of the neighborhood identity: resale price could indicate the neighborhood’s target group; lease commence date could show the neighborhood age; resale volume can picture the size of a neighborhood. Plotting the three factors in one figure, we can compare the different identities of neighborhoods.

In Punggol and Sengkang, the housing age is young while of large volume and low price, indicating they are large new residential neighborhood. This finding matching with their identity as the “new town”. Contrary to this is Bukit Timah that is old, with a small volume of housing and high price. According to Wikipedia, owing to its prime location, Bukit Timah has some of the densest clusters of luxury condominiums and landed property in the city, with very little public housing.
The code of this project can be found here.