Business strategy development supported by machine learning
Introduction
The battle for consumers’ grocery spend is more intense than ever, with new store concepts, pricing strategies, delivery formats, and market volatility putting retailers under pressure to deliver increased value with decreased costs. Supermarket companies have invested heavily in big data, with analytics and data science forming a core part of their decision-making to help them get ahead of the competition.
As little grocery data has been made publicly available before, I would like to explore how data analysis is able to inform grocers to maximize the efficiency of decision-making. The Tesco grocery dataset records in-store purchases done in Tesco shops, business proposals for physical grocery stores can be studied in light of this dataset.
The study topic is specified as Forecasting and Planning New Grocery Stores, it contains two subtopics, one is where are the high-potential locations to open new stores, followed by shopper targeting and product ranging strategies of the new store.
According to the literatures, the influence factors of the two subtopics include demographics, transport, economic, competition, etc. Therefore I introduce the London LSOA Atlas dataset that provides a summary of demographic and related data for each Lower Super Output Area in Greater London to support further analysis.
Data Preprocessing
Exploring the imported datasets, notice that there are numerous variables in grocery and demographic datasets, whereas many of them describe outdated information (like demographic of 2009) and information not relevant to the topic (like energy), therefore we need to filter out the variables that could be used in the analysis.
The selected factors include transaction number, food weight, the fraction of products of type (including beer, dairy, eggs, fat oils, fish, fruit & vegetables…), demographic (including population, gender, age, household number…), population density, employment & unemployment rate, healthy rate, transport accessibility.
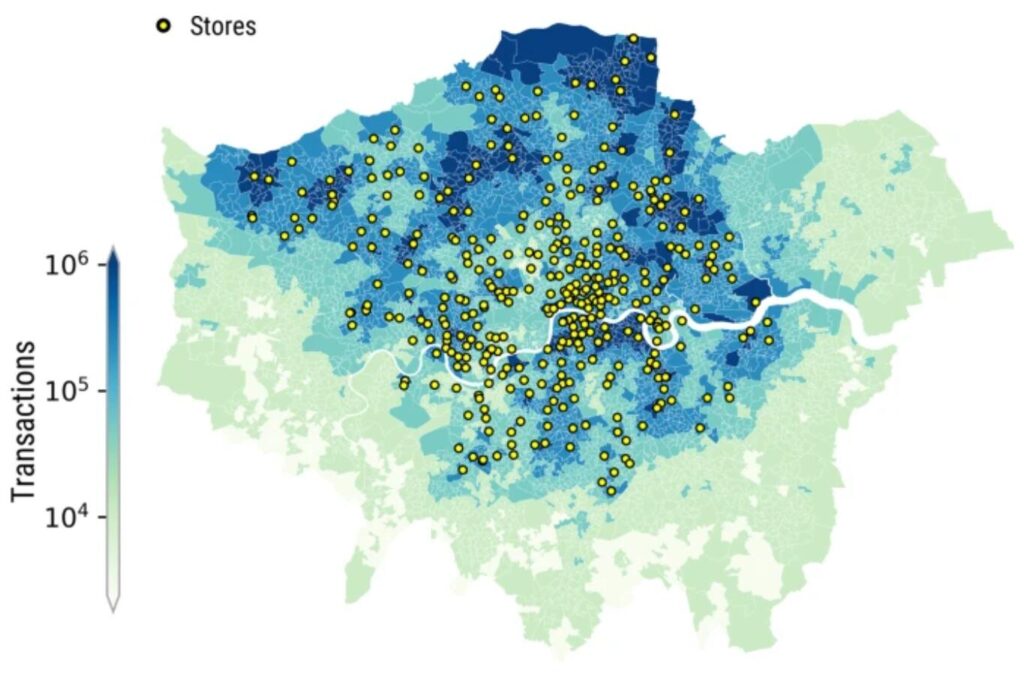
According to the article that detailed the Tesco dataset, the concentration of Tesco stores is higher in the northern part of London. As a result, some areas of the city exhibit low penetration (ratio of customers to population).
The figures in the Technical Validation part of the article demonstrate to achieve a high correlation (cor>0.7) for LSOAs, the threshold of representativeness should be between 0.3-0.35. When areas with at least 0.15 representativeness, one is left with 70% of the total number of areas and the correlation falls to 0.4, where can be identified Tesco stores low-coverage areas.
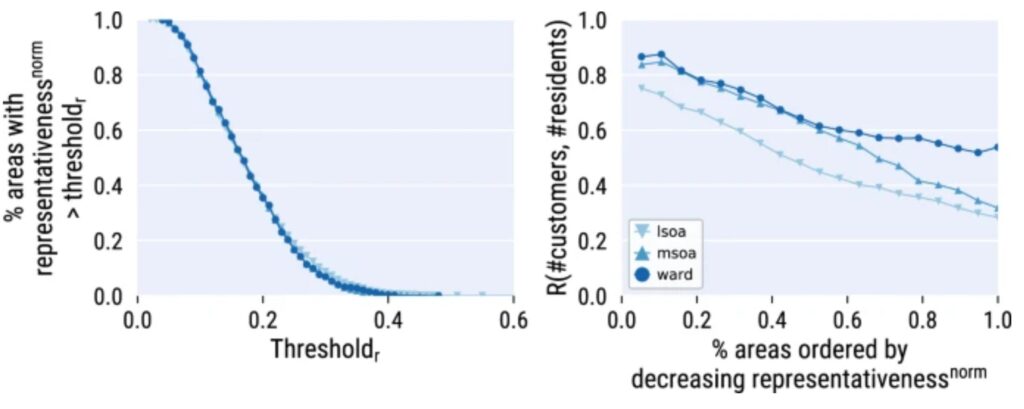
In areas of high representativeness, customers can accurately represent the demographic characteristics of the area, which could be used as data for modeling. Conversely, areas of low representativeness indicate low coverage of Tesco stores and can be considered as potential areas for new stores. Based on this principle, classify the LSOA areas into two categories.
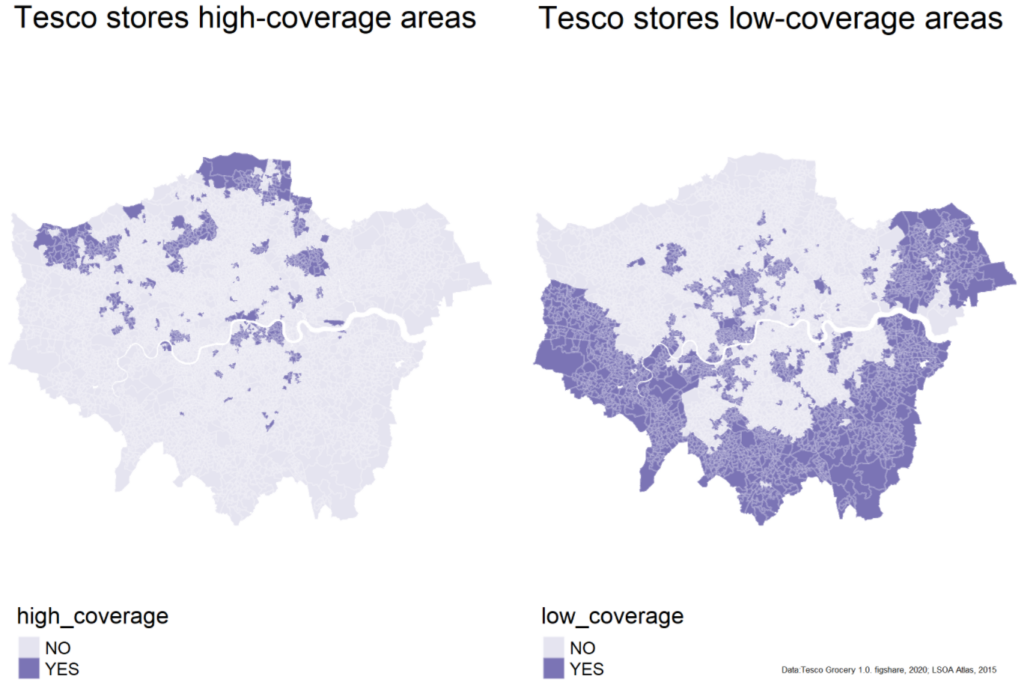
Compare the mapping outcome with the distribution of Tesco stores, can observe coinciding spatial patterns: areas with high-coverage aggregate at the northern-west of London and areas with low-coverage areas distribute at the southern-east. Therefore, the data classification is valid and can be used in further analysis.
Location prediction of new stores
To maximize the business efficiency of new shops, they need to be placed where they are expected to benefit the most. The revenue information is not provided in the grocery dataset, but because grocery stores have similar margins per item and small net margins, the number of transactions can act as the indicator of revenue.
In this section, I use the areas of high representativeness to build a machine learning model in order to predict the number of transactions for areas of low store coverage.
Exploratory data analysis
Use areas of high stores coverage, select all possible influence factors of transactions, and run correlation analysis between transactions number and selected factors:

There are many other unknown confounding factors that affect transaction numbers, such as shop competition, campaign promotion, etc. The highest correlations so far are population(0.5), healthy rate(-0.37) and households(0.35). In order to improve the accuracy of the model, I added all factors with a correlation > 0.2 to the model as influencing factors.
Machine learning
The input factors of the machine learning model include the transaction number, food weight, population, senior rate, average age, household number, unemployment rate, income, car availability, and healthy rate, the method used is random forest.
According to the model performance evaluation outcome, 43.5% of the transaction number can be explained by the variables that we have used. Because there are often unpredictable explanatory variables affecting dependent variables in social science statistics, I considered the model performance as acceptable. Moreover, the transaction number prediction does not require a precise value, and reading the relevant results is sufficient to determine which areas will have higher transaction numbers.
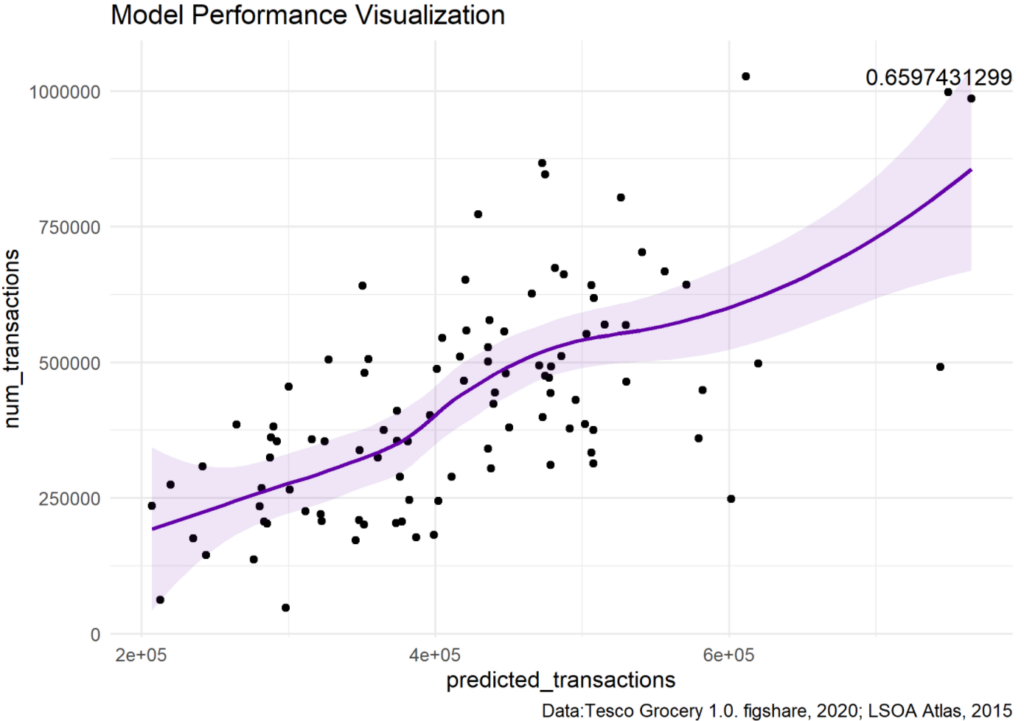
Visualizing the model performance, the predicted transactions and true transactions have a positive correlation of 0.66. There are undeniably some outliers, but since LSOAs have a relatively small unit area while the service area of a Grocery is beyond one unit area, one can focus on the aggregation of high predicted transaction areas to reduce the effect of outliers when identifying the potential position.
Mapping predicted outcome
The map shows that the most obvious agglomerations are in Barking and Dagenham (to the northeast of the map), followed by the Bexley and Greenwich areas across the river. There are also some agglomerations close to central London, however, looking at the spatial location of Tesco stores, we see that there are already many shops in this area, the low coverage is probably due to competition and loss of customers, and further investment in this area would be less efficient. Therefore, the most ideal and efficient location for new stores would be in the northeast of London (Barking and Dagenham, Bexley, Greenwich).
Shopper targeting and product ranging strategies of the new store
Product ranging means the proportion arrangement of the product types on the shelf of the store. In order to achieve high performance, the product ranging needs to target its shopper’s shopping preferences. In this section, I take new stores in Barking and Dagenham area as examples, use the average product ranging in London as the benchmark, study what types of products need to be stocked more/less based on the shopper’s preference.
Exploratory analysis
As there are many types of products and demographic variables, it’s important to get an overview first. Select all product types and possible influence factors, create a corrplot that includes all the correlations.
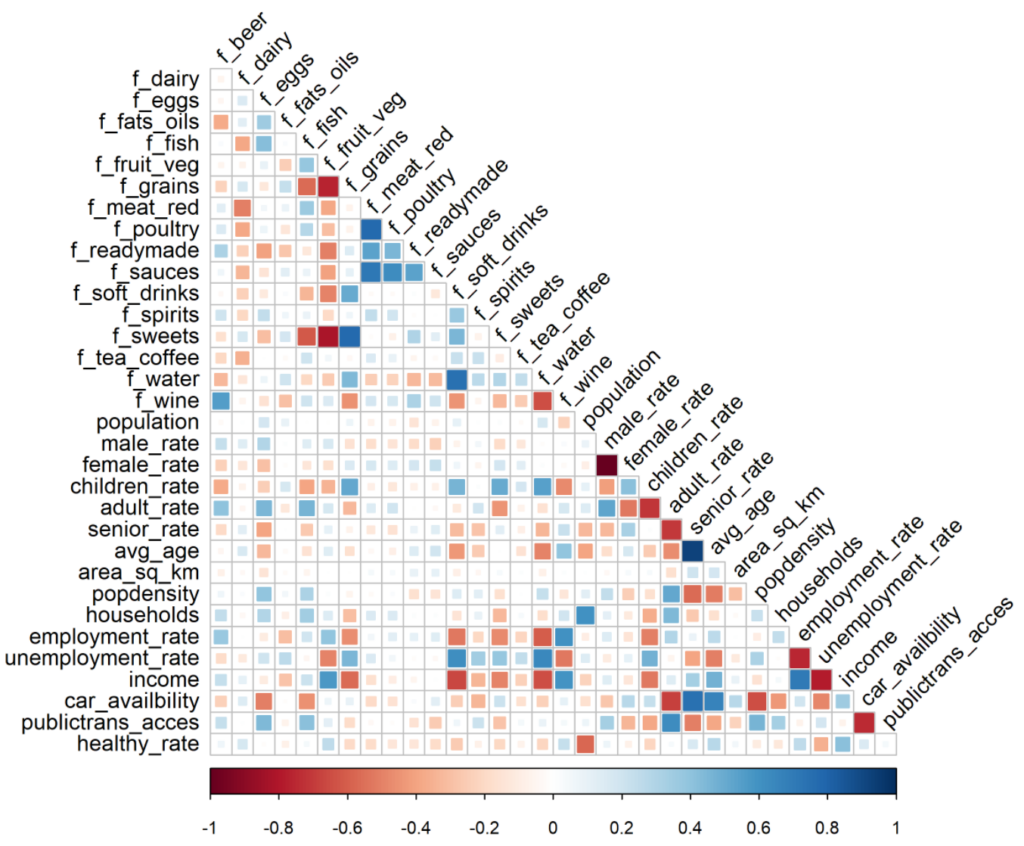
Observing the figure above finds that children rate, adult rate, average age, employment rate, unemployment rate, income, transport accessibility have a high correlation with people’s product choices.
Difference analysis
The next step is to compare values of the high correlated factors in Barking and Dagenham with the average values of London, therefore picture the shopper’s characters of the new store.
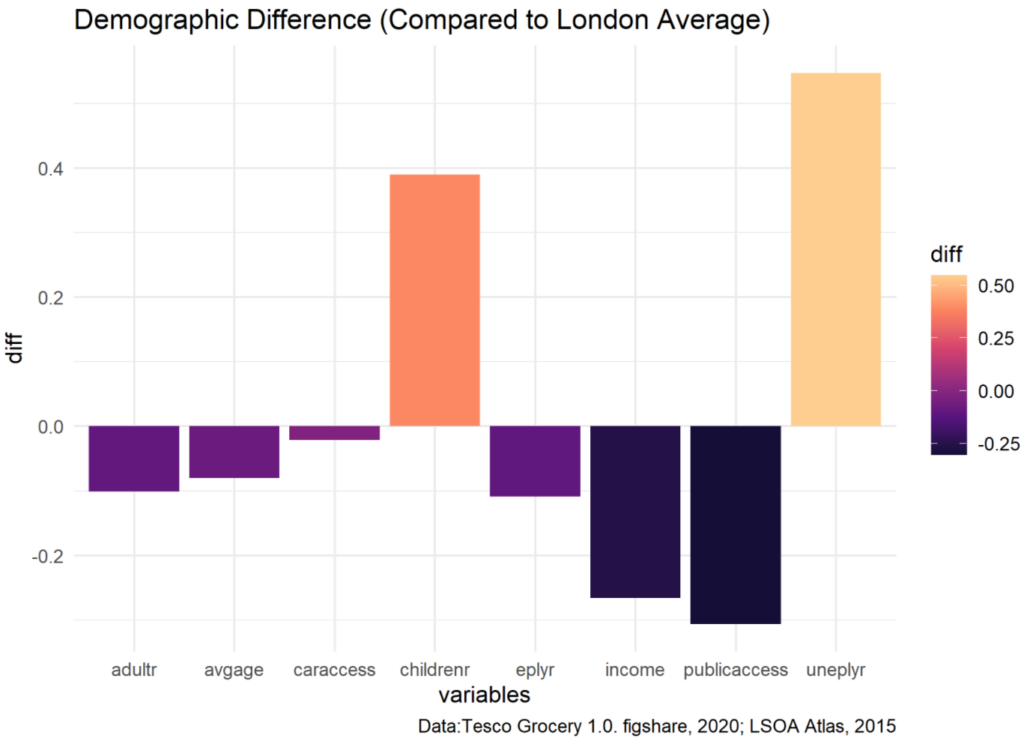
The result shows in Barking and Dagenham, the children rate and unemployment rate are significantly higher than the mean value of London, with income and public transportation access lower than average, indicating the new store locates in a community of relatively low economic status. Further, I extract these four factors and analyze how they affect the purchase of products in various categories, this is done by analyzing positive/negative correlation and the correlation values.
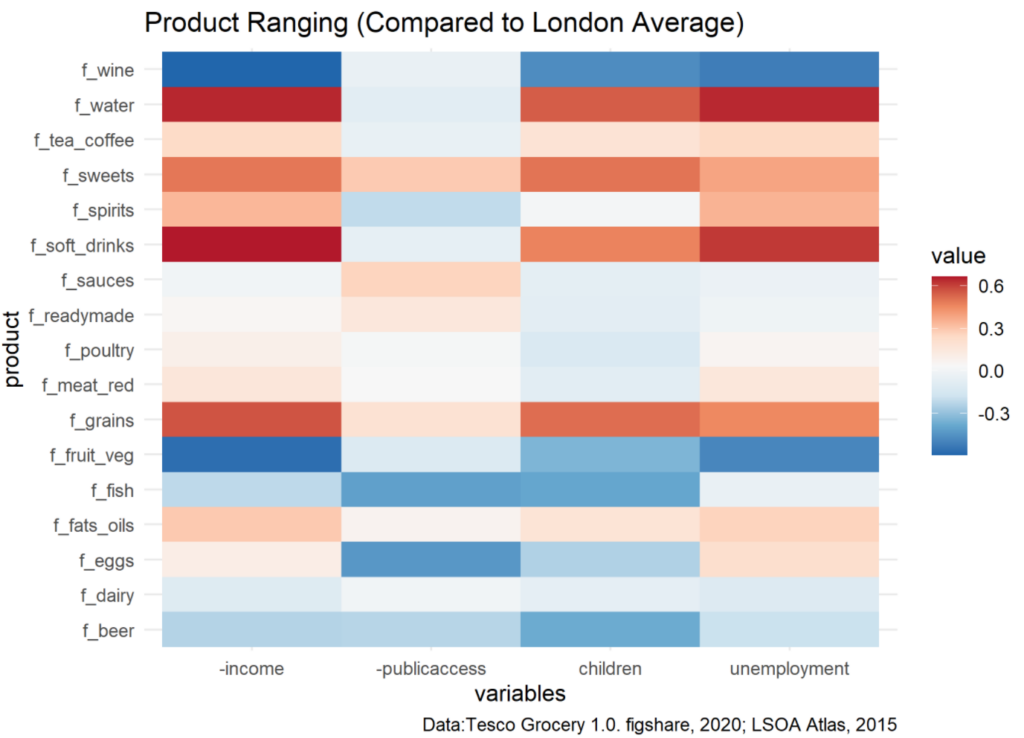
Reading from the figure, the purchase amount of wine, fruits and vegetables, fish, and beer in Barking and Dagenham will be lower than the London average, therefore can reduce the diversity or stocking of those products to save shelf spaces and expenditures for other items. The purchase amount of water, sweets, soft drinks, and grains will be much higher than average, suggesting the new store should stock a larger proportion of these products for the specified offers to its shoppers.
Discussions
The above exercise gives a general idea of how data analysis can help grocery shops to achieve higher commercial efficiency. With an area’s demographic and social-economic data, one can predict people’s grocery spend and therefore make effective business decisions of where to open new stores. Moreover, studying shopper’s preferences can help with developing product ranging strategies of good selling performance. In the analysis, I have been aiming to maximize efficiency to produce results, however, in the second subtopic, I realized that the lower-income groups have less access to healthy food due to price constraints or some other reasons, so if stores reduce healthy food on the shelves and replace it with high-calorie sweets or drinks in pursuit of commercial efficiency, will this increase the inequality in dietary health? Hopefully, in real practice, data analysis will not only enable grocers to operate better but also help them to make more socially responsible business decisions.